matplotlib 으로 하나의 프레임에 여러개 그래프 그리는 방법
fig, ax = plt.subplots()- fig (figure)
- 데이터가 담기는 큰 프레임을 의미 (여러개의 그래프를 그릴 수 있는 액자와 같다)
- 크기, 모양을 변형할 수 있음
- ax (axes)
- 실제 그래프가 그려지는 캔버스를 의미
- 모든 그래프는 axes 에서 실행 되어야 함
1. 4개의 axes를 가진 하나의 figure생성 (figure의 크기는 (10,8))
fig, axes = plt.subplots(nrows=2, ncols=2, figsize=(10, 10))2. 그래프 그리기
# 필요 라이브러리 불러오기
import matplotlib.pyplot as plt
import numpy as np

# 임의의 데이터 생성
x_data = np.linspace(0, 5, 100)
y_data = np.sin(x_data) * np.exp(-x_data/10)

# fig, axes 정의
fig, axes = plt.subplots(nrows=2, ncols=2, figsize=(10, 10))

# ax 중에서 0행 0열
axes[0, 0].plot(x_data, y_data)
axes[0, 0].set_title("title", fontsize=16) # 그래프 제목 설정 (.set_title())

# ax 중에서 0행 1열
axes[0, 1].plot(x_data, y_data, lw=2, color="red")
axes[0, 1].set_xlabel("x_label", labelpad=5, fontsize=8, color="red") # x축 라벨 옵션 설정 (label 제목/위치/폰트크기/색깔)
axes[0, 1].set_ylabel("y_label", labelpad=5, fontsize=8, color="blue")
axes[0, 1].set_title("set_xlabel & set_ylabel", fontsize=16)

# ax 중에서 1행 0열
axes[1, 0].scatter(x_data, y_data) # plot형태를 scatter 형태로 그리기
axes[1, 0].set_xlim(-5, 8) # x축 범위 설정
axes[1, 0].set_title("set_xlim(-5,8)", fontsize=16)

# ax 중에서 1행 1열
axes[1, 1].scatter(x_data, y_data)
axes[1, 1].set_ylim(0, 8) # y축 범위 설정
axes[1, 1].set_title("set_ylim(0,8)", fontsize=16)

# subplot 간 간격 조절
plt.subplots_adjust(left=0.1, right=0.9, bottom=0.1, top=0.9, wspace=0.7, hspace=0.5)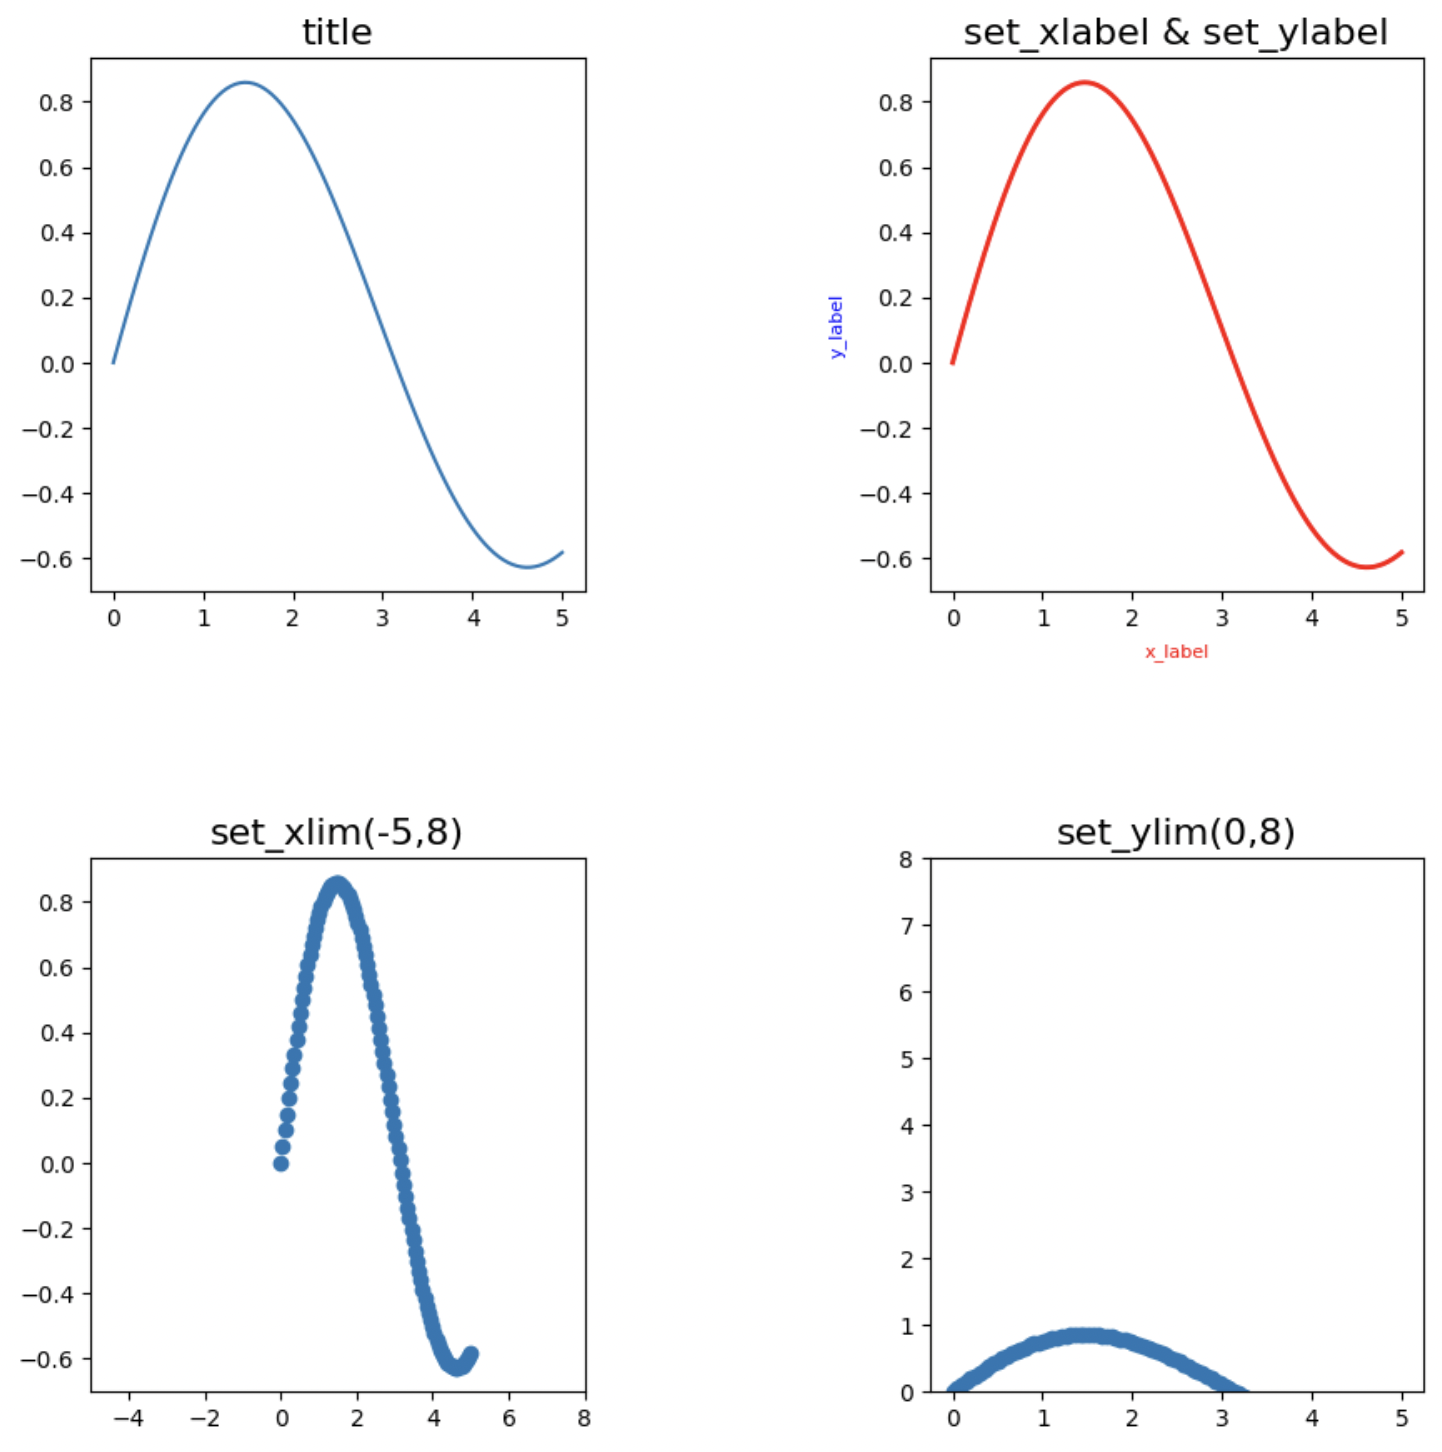
반응형
'Language > python' 카테고리의 다른 글
| [Python] 파일 확장자명 일괄변경 (0) | 2023.04.27 |
|---|---|
| [Python] 리스트 안의 원소들을 한번에 int type 으로 변환 (0) | 2023.02.14 |
| [Python] Image 읽는 방법 (0) | 2023.02.10 |
| [에러] TypeError : can't convert CUDA tensor to numpy (0) | 2023.02.09 |
| [numpy] numpy 소수점 반올림하기 / array 전체 출력 / 출력 형식 변경 (0) | 2023.01.25 |